Historical Automobile Sales Analysis

Analysis of historical automobile sales data to uncover trends, patterns, and insights that can help in forecasting future sales and making informed business decisions.
View the Project on GitHub alxmares/Historical_Automobile_Sales_Analysis
🛠️ Tools and Technologies Used


📊 Exploratory Data Analysis (EDA)
The EDA phase involves understanding the data structure, identifying patterns, and visualizing relationships among different variables. Key steps include:
- Data Loading: Importing data from a CSV file.
- Data Cleaning: Handling missing values and correcting data types.
- Data Visualization: Using plots to understand distributions, trends, and correlations.
🧠 Key Analysis Techniques
| Technique | Description |
|---|---|
| Time Series Analysis | Analyzing sales trends over time to identify seasonal patterns and long-term growth. |
| Correlation Analysis | Understanding relationships between different variables such as economic indicators and sales. |
| Geospatial Analysis | Using Folium to visualize sales data on a map for geographical insights. |

📈 Key Findings
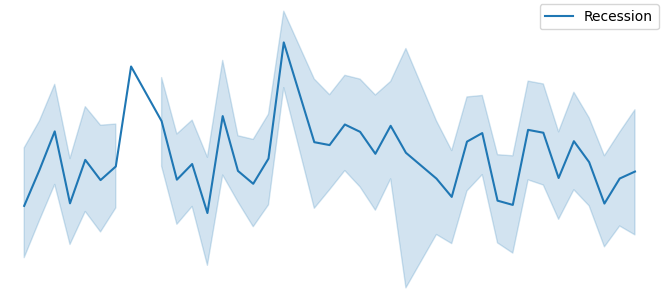
- Seasonal Trends: The analysis revealed significant seasonal trends in automobile sales, with peaks during certain months.
- Economic Impact: Correlation analysis showed a strong relationship between economic indicators and automobile sales, suggesting that macroeconomic factors play a crucial role in the industry.
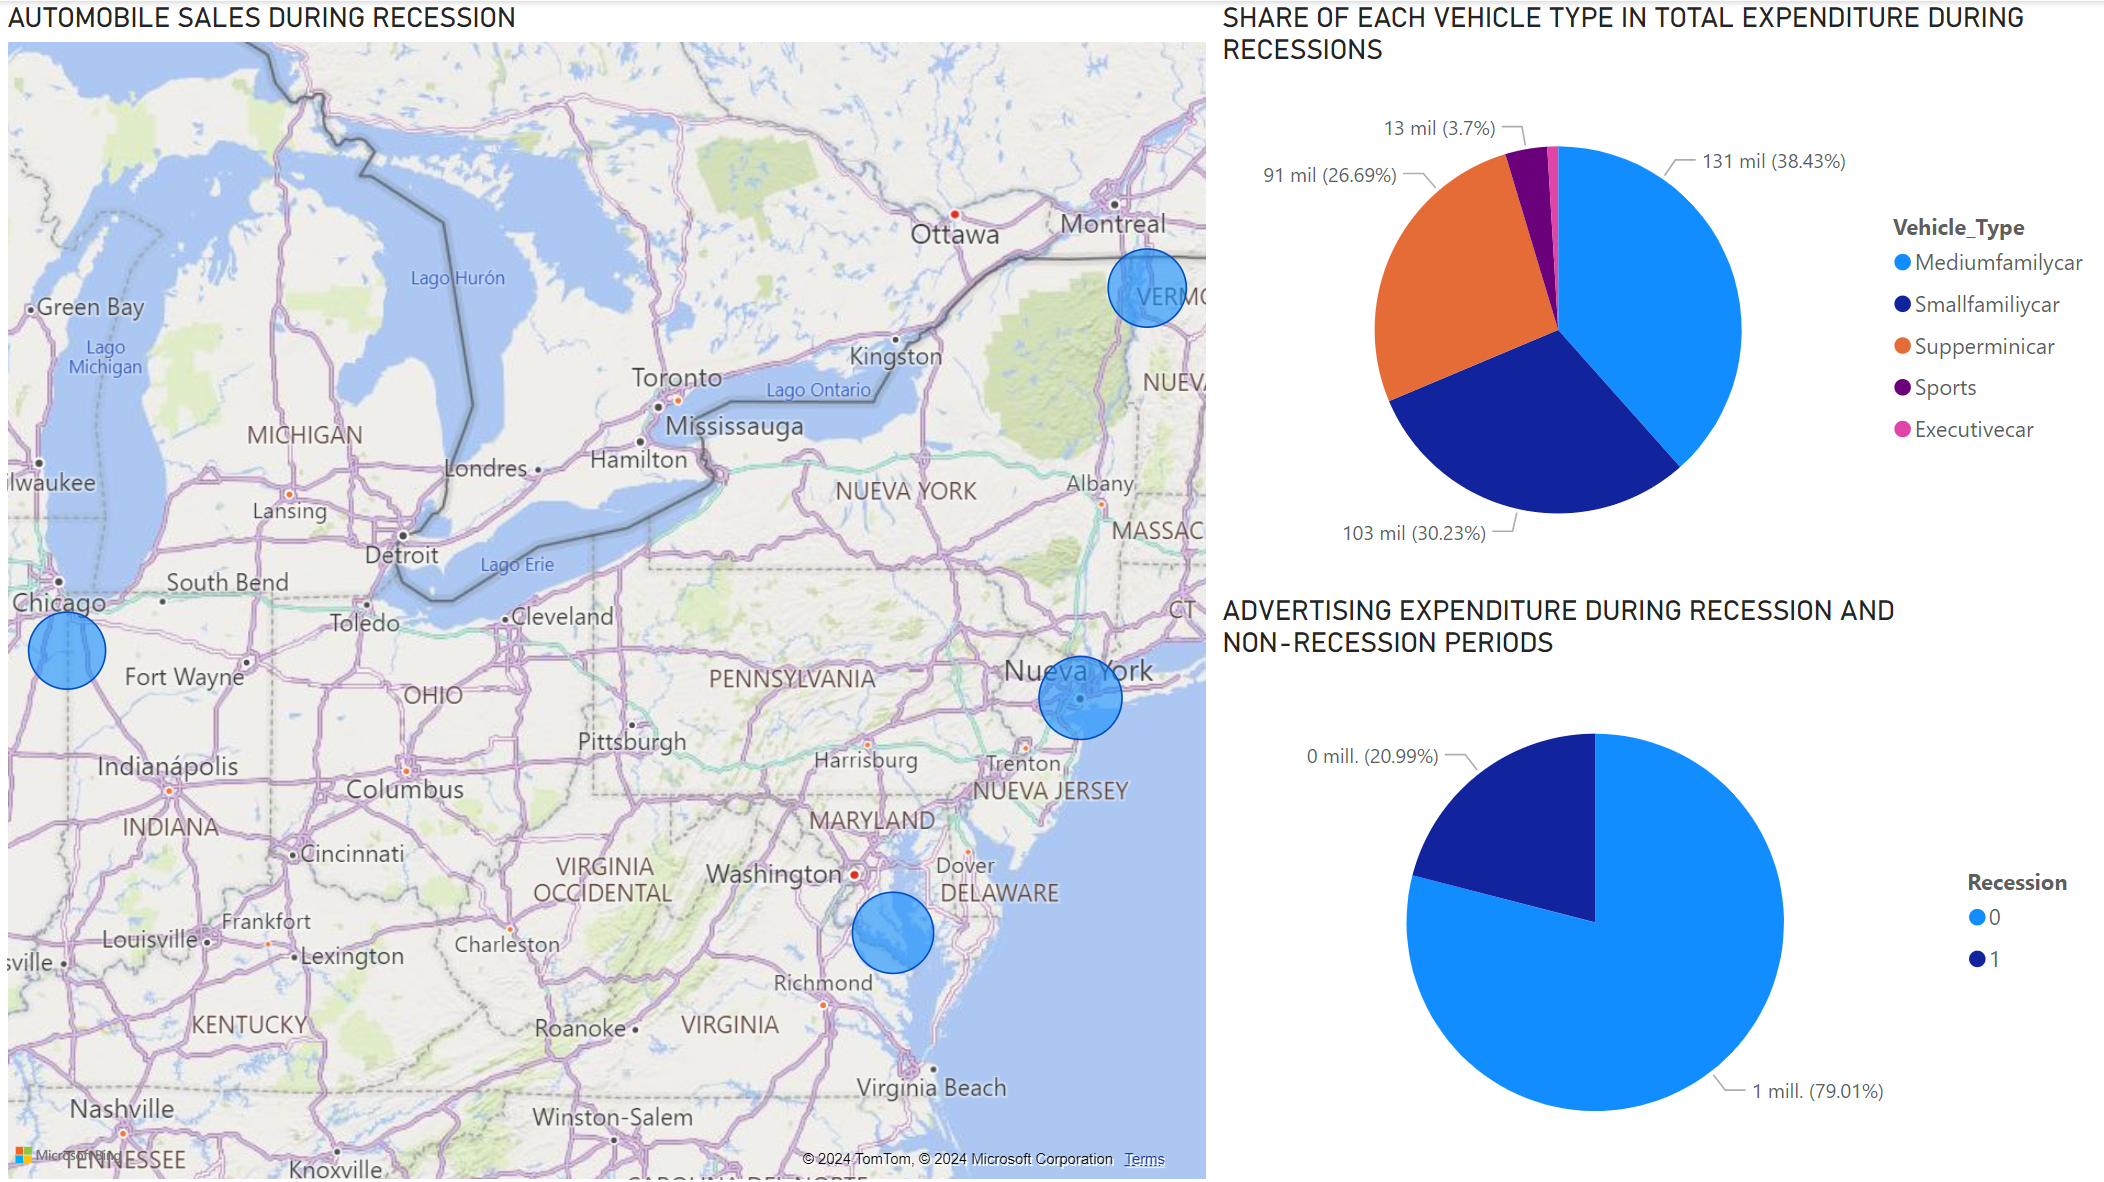
- Geographical Insights: Sales performance varies significantly across different regions, highlighting the importance of localized strategies.
📊 Power BI Report
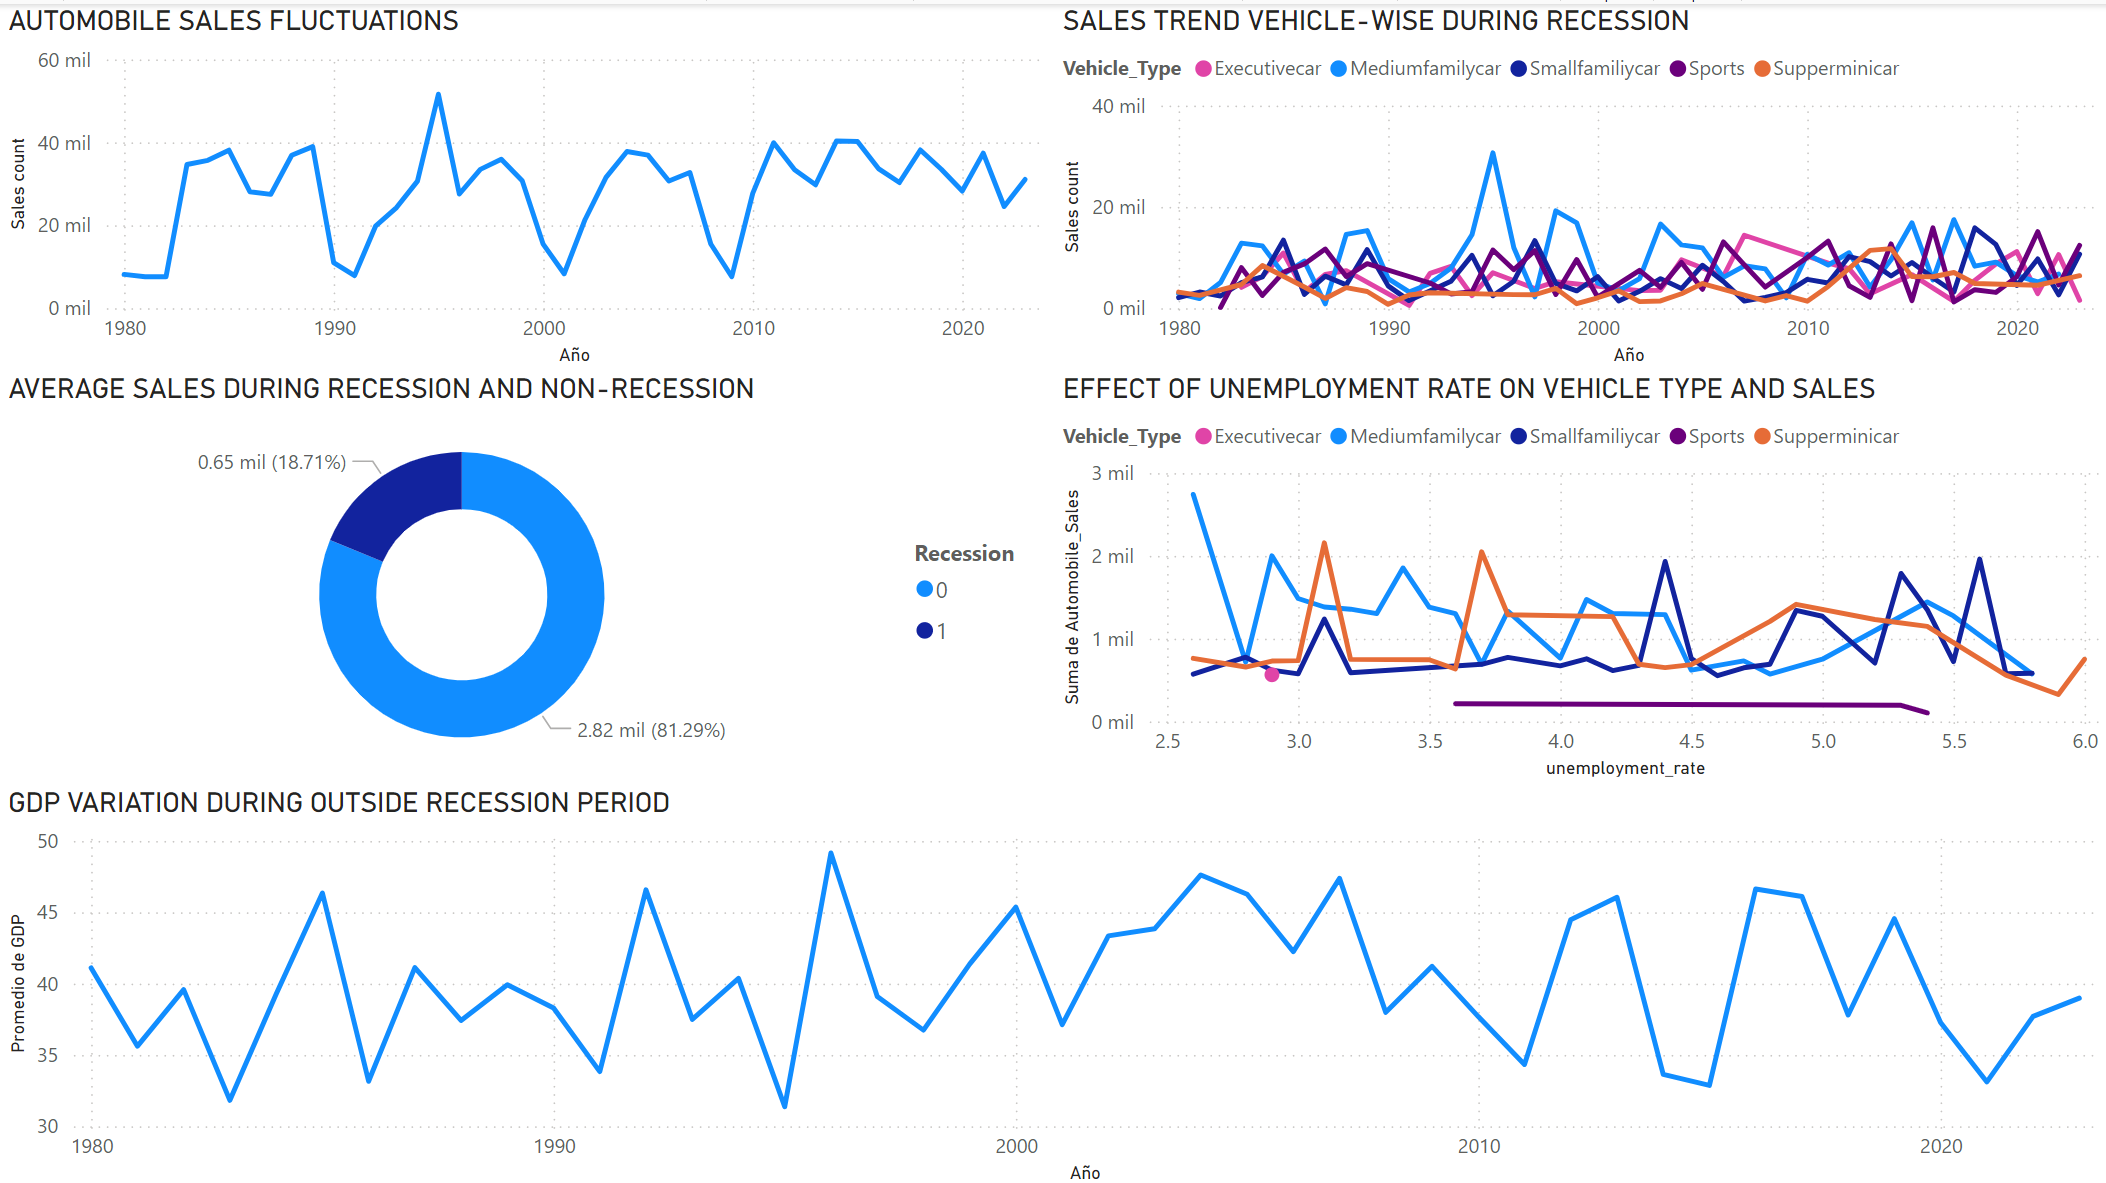
To enhance data analysis and visualization, a comprehensive report was created using Power BI. This report includes:
- Interactive Dashboards: Allowing users to filter data and explore insights dynamically.
- Visualizations: Including bar charts, line graphs, and maps to represent sales trends and patterns.
- KPI Tracking: Monitoring key performance indicators over time to assess sales performance and economic impact.

